
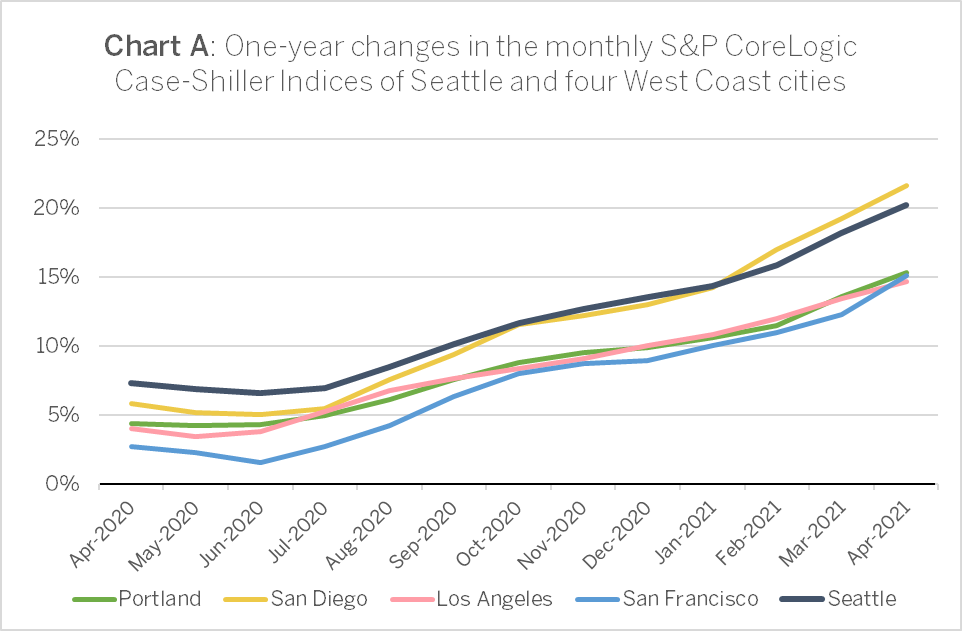
As Seattle roasted under the heat dome in late June, S&P Dow Jones released their April 2021 CoreLogic Case-Shiller Home Price Index. The index showed historic residential price advances nationwide, with only Chicago falling short of 10 percent growth year-over-year. With gains of 20.2 percent and 21.6 percent respectively, Seattle and San Diego continued to outdistance their peer cities on the West Coast. For Seattle, this was the highest growth ever recorded on the index. Prices in Phoenix outpaced the rest of the nation at 22.3 percent. In this report, we will look at three factors driving and shaping residential prices in the Seattle metropolitan area: inventories of homes for sale, mortgage interest rates, and the ongoing shift among urban and suburban areas of Central Puget Sound.
Home prices continue to accelerate nationally
In addition to the aforementioned rates of growth for the leading cities, the CoreLogic Case-Shiller index[1] results published by S&P Dow Jones on 29 June showed year-over-year residential price growth of their 20-City Composite Index falling just short of 15.0 percent. The Pacific Coast cities of Portland, Los Angeles, and San Francisco saw their indices rise by 15.4 percent, 14.7 percent, and 15.1 percent, respectively. This marked the first month since July 2019 that San Francisco did not trail her West Coast peers (Charts A and B).
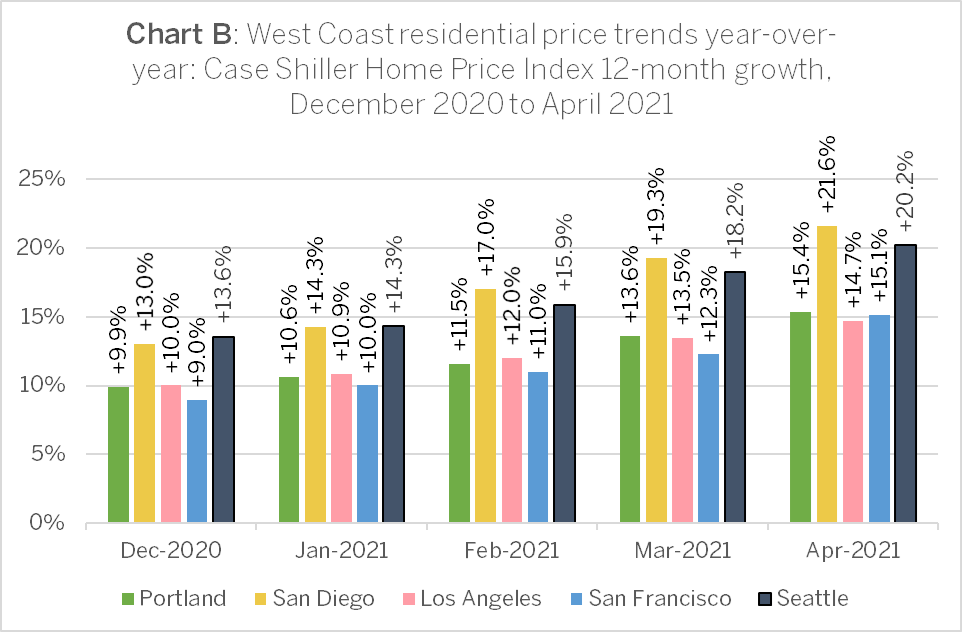
Craig J. Lazzara, Managing Director and Global Head of Index Investment Strategy at S&P Dow Jones Indices, described the index gains as “broadly-based: all 20 cities rose, and all 20 gained more in the 12 months ended in April than they had gained in the 12 months ended in March.”
April’s performance was truly extraordinary. The 14.6 percent gain in the National Composite is literally the highest reading in more than 30 years of S&P CoreLogic Case-Shiller data. Housing prices in all 20 cities rose; price gains in all 20 cities accelerated; price gains in all 20 cities were in the top quartile of historical performance. In 15 cities, price gains were in [the] top decile. Five cities – Charlotte, Cleveland, Dallas, Denver, and Seattle – joined the National Composite in recording their all-time highest 12-month gains.[2]
Two accelerants and one shaping factor
Weak base effect from the uncertainty of a year ago has surely contributed to this year’s rapid price increases. Still, there are factors in our present environment that are fueling and shaping market behavior. Here we look at three: historically low inventories, a sea change in mortgage interest rates, and post-COVID migration patterns.
Inventory remains near all-time lows
By the traditional definition of six months in inventory, the Seattle MSA has been a seller’s market for nearly a decade. June 2021 marked a year of less than a month in residential inventories in the region. While propelling prices higher, this condition has ignited a yet-unbroken cycle in which homeowners not compelled by circumstances to sell may hesitate to do so. Some who would otherwise consider a move-up purchase are concerned that no home meeting their preferred criteria will be available for purchase once they have sold. This keeps additional homes off the market, and may partly explain why homeowner tenure in the region has begun to increase, reversing a decade-long trend. Brokers should be prepared to explain these market dynamics and come prepared with a plan to expedite both sale of the current home and purchase of the client’s target home.

Mortgage interest rates have bottomed
Prospective homebuyers who have hereunto delayed purchases may be pressed to act by rising interest rates. Freddie Mac forecast in April that mortgage interest rates would rise through this year and to the end of 2022. June data appeared to confirm this forecast in the trends for the 30-year and 15-year fixed-rate mortgages.
‘Mortgage rates have risen above three percent for the first time in ten weeks,’ said Sam Khater, Freddie Mac’s Chief Economist. ‘As the economy progresses and inflation remains elevated, we expect that rates will continue to gradually rise in the second half of the year. For those homeowners who have not yet refinanced—and there remain many borrowers who could benefit from doing so—now is the time.’[3]
The crisis in the cities is over, with buyers spotting opportunities
A year has passed since last summer’s unrest in the streets of Capitol Hill. And with the region’s employees widely embracing work-from-home policies introduced last year, we again turn to the question of suburban and exurban flight as they pertain to Seattle and neighboring cities. In the April Case-Shiller report, Craig Lazzara repeated the inconclusive remarks of his reports in the past eight months regarding home buyers exiting the cities:
We have previously suggested that the strength in the U.S. housing market is being driven in part by reaction to the COVID pandemic, as potential buyers move from urban apartments to suburban homes. April’s data continue to be consistent with this hypothesis. This demand surge may simply represent an acceleration of purchases that would have occurred anyway over the next several years. Alternatively, there may have been a secular change in locational preferences, leading to a permanent shift in the demand curve for housing. More time and data will be required to analyze this question.[4]
We do observe that monthly home sales in the largest, densest cities in the three-county Seattle MSA are outnumbered by home sales in the MSA, but outside those cities (Chart C). This is no new development, and we have been reporting some degree of suburban and exurban migration since 2018. However, data from the Northwest Multiple Listing Service (NWMLS) recorded in March and April 2021 show an even sharper increase in the number of home sales in these more urban destinations (Chart D).
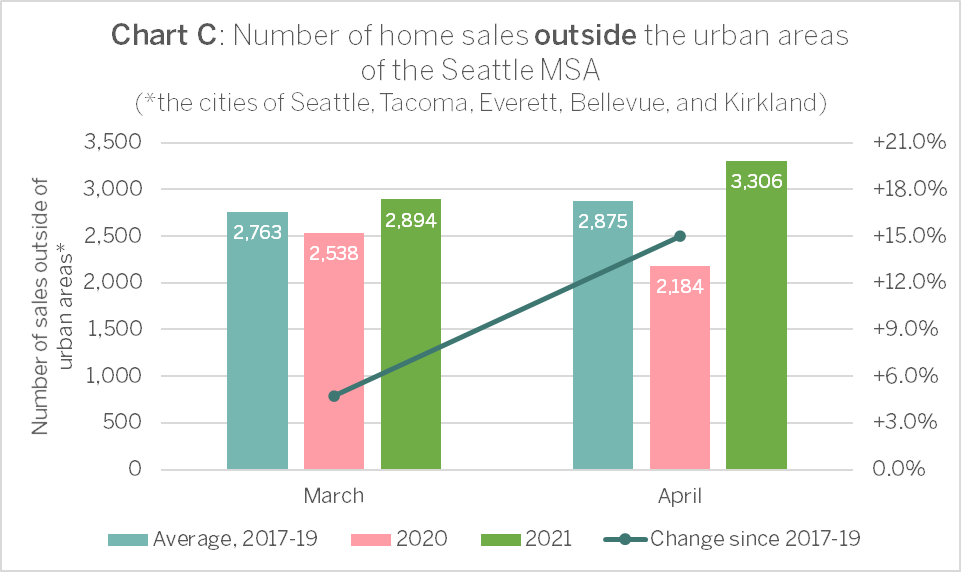
We may attribute these new urban buyers to the perception of buying opportunities in the wake of adverse reporting over the past year. They may also reflect latent demand, having given up waiting for an inventory surge or slower price growth. Regardless, these year-over-year increases of more than 20 percent in monthly transactions are a contrary indicator to be measured against the outflow of buyers to suburbs and exurbs in the Greater Puget Sound region.

For more details on the April 2021 Case-Shiller Index results, download the S&P Dow Jones Case-Shiller summary report. For details on the market implications of our reports for homes in your neighborhood, contact a local RSIR broker.
###
[1] Published by S&P Dow Jones, the Case Shiller Index surveys resales of residential homes in the Seattle MSA. The index notably does not account for condominium sales. “S&P CoreLogic Case-Shiller Index Shows Annual Home Price Gains Surged to 14.6% in April,” S&P Dow Jones, New York, 27 April 2021.
[2] Ibid.
[3] “Mortgage Rates Rise Above Three Percent,” press release, Freddie Mac, 24 June 2021.
[4] S&P Dow Jones, New York, 27 April 2021.